
Accurately evaluate hPSC culture conditions by monitoring colony growth area
Points
Continuous measurement of hPSC (including both hiPSC and hESC) colony area is an important metric for the evaluation cell health and uniformity.
Overview
Regardless of whether hPSCs are passaged as single cells or clumps, those cells will eventually gather and form colonies. Ideally, individual colonies are of similar size and as large as possible. However, clump passaging generally results in clumps of different size, increasing the variability in the size of developing colonies. Small clumps often take a long time to grow, and growing colonies can fuse with adjacent colonies.
It is known that the characteristics of undifferentiated hPSCs are unstable. Transformed clones with altered characteristics tend to proliferate more quickly, so close attention is required when a fast-growing colony emerges. Continuous measurement of individual colony area is useful as an index for evaluating cell condition and uniformity.
Current
Issue-1
It is difficult to track each single colony.
Visual observation that do not make use of cell staining are non-destructive, but the shape of the colonies changes intermittently, making it difficult to track and identify each colony, especially over long intervals in the observation period.
Solutions
Phase contrast imaging and analysis allow for non-invasive automatic hPSC colony identification and area measurement.Analysis of hPSC phase contrast images allows for the automatic generation of colony mask overlays and calculation of area measurements.
Both the BioStudio-T*, a cell observation system which may be installed inside an incubator, allow for the acquisition of phase contrast images over an extended period without perturbing the culture environment.
*This product has been discontinued. If you have any questions about cell cultures, assays, or products, please contact us using the contact form.Cell image analysis software Cell Analysis Module
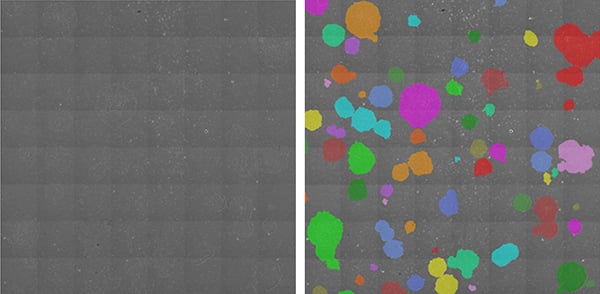
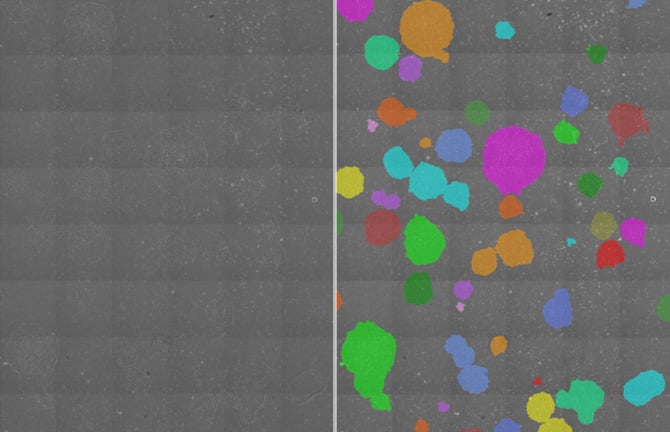
Identification of hiPSC colony area by phase contrast image analysis
Left: phase contrast image, Right: colonies with mask overlays generated using image analysis (displayed in random colors)
Cell line used: Human induced pluripotent stem (iPS) cell line Tic-FX (JCRB Cell Bank, JCRB1331.01, MRC-5 derived, Substrain of Tic iPS cell (JCRB1331) adopted to feeder-free culture)
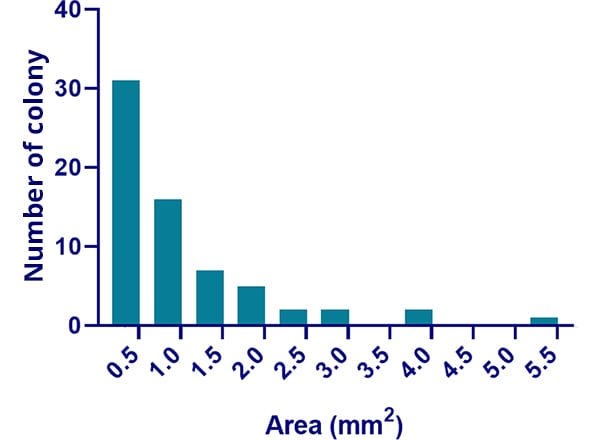
Distribution of iPSC colony size. Measurements are displayed in units of mm2.
Utilization scene
As an evaluation criterium for developing cell culture processes and procedures
- Validation of culture conditions (culture media composition, passaging methods, variations in procedures among operators)
- Comparison of proliferation among cell lines
Reference
Stem Cells Transl Med. 2015;4 (7):720-30
PLoS One. 2013;8(1):e54122
Cell image analysis software
NIS-Elements Cell Analysis Module
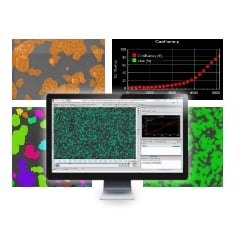
The following application softwares are for the purpose that specific image analysis can be performed simply using Nikon's Image Analysis Software in the field of research and development. As we have developed image analysis algorithms for many years and accumulated know-how, we have started to provide add-on Modules.
Click here for detailsWith image analysis technology and quality evaluation know-how
Contributes to solving cell culture issues.
ConsultInquiry form
Share this page