Quantifying the confluency of hPSC cultures to reduce variations in passage timing
Points
Measuring the area within the field of view covered by hPSC (including both hiPSC and hESC) colonies allows for quantification of the degree of confluency, which is important for accurately assessing when to passage the cell culture.
Overview
In order to continuously culture cells without altering their quality, it is generally desirable to passage cells at subconfluency, when they cover about 70 to 80% of the culture vessel surface. However, visual determination of the degree of subconfluency results in passage timing variability. A need thus exists for quantifying the cell coverage area in a consistent, unbiased manner.
This metric may also be used to monitor proliferation rate, which is useful for evaluating the effect of different cell culture conditions.
Current
Issue-1
Variability in passage timing.
Qualitative visual determination of the degree of subconfluency may result in variability in passage timing due to differences in judgment among operators.
Issue-2
Unreliable prediction of when cells will reach the desired degree of subconfluency.
Cell proliferation rate varies with cell type and culture conditions, making it difficult to predict when the desired degree of subconfluency will be reached for passaging.
Solution
Measurement of cell coverage area informs the degree of subconfluency and may be used as a criteria in determining the correct timing for passaging.Automatically mask iPSC colonies present in phase contrast images and quantify the covered area.Time-lapse image acquisition informs cell proliferation rate, allowing for the prediction of when the desired degree of subconfluency will be reached. This also allows operators to monitor cell growth characteristics.
Such capabilities are provided by the BioStudio-T*, a cell observation system that can be installed inside an incubator, phase contrast images can be captured over a long period without perturbing the culture environment.
*This product has been discontinued. If you have any questions about cell cultures, assays, or products, please contact us using the contact form.Cell image analysis software Cell Analysis Module
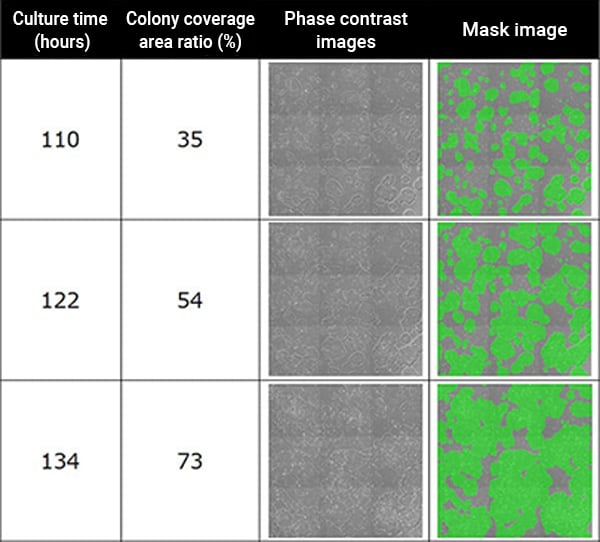
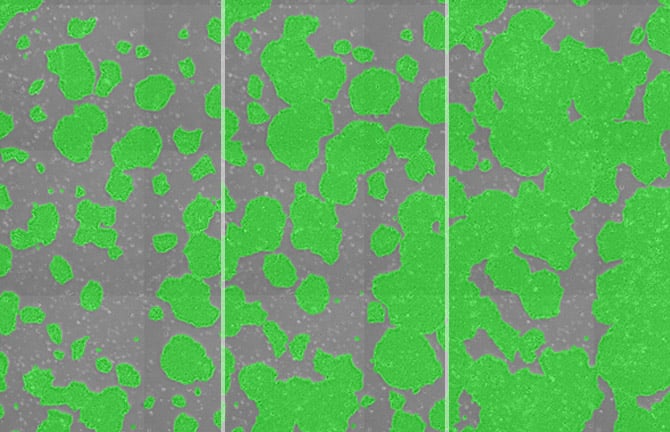
Phase contrast images of iPS cells (left) and images of colony regions masked in green (right). The coverage area is converted into a percentage (%) for display. The examples provided here are 3x3 field cell images and associated mask images.
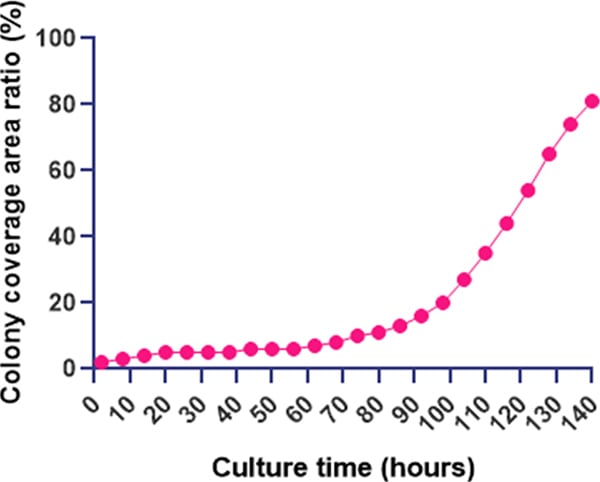
Time course of change in iPS cell colony coverage area. Colony area is displayed as a percentage (%)
Utilization scene
To determine the cell culture passage timing
To monitor changes to the cell proliferation rate
To measure the effect of procedures on cell proliferation (or cell death)
- Changes in composition of culture media
- Changes in passaging procedure
For comparison of proliferation rate among cell lines (when selecting cell lines or developing methods for establishing cell lines)
Cell image analysis software
NIS-Elements Cell Analysis Module
The following application softwares are for the purpose that specific image analysis can be performed simply using Nikon's Image Analysis Software in the field of research and development. As we have developed image analysis algorithms for many years and accumulated know-how, we have started to provide add-on Modules.
Click here for detailsNikon will contribute to solving your cell culture issues with its image analysis
techniques and know-how on cell quality evaluation.
Click hereInquiry Form
Share this page