Quantifying confluency to reduce MSC passage timing variation
Point
Quantification of the proliferative capacity of human somatic stem cells in culture provides an important index for the objective evaluation of cell state.
Overview
It is known that the proliferative capacity of human somatic stem cells , such as MSCs (mesenchymal stem cells), will decrease with increasing passage number to the point that cells eventually stop dividing. For this reason, it is useful to know the proliferative capacity of cells in culture over time.
In many cases, it is considered desirable to perform passaging at subconfluency, when about 70 to 80% of the culture vessel surface is occupied by cells. This judgment is normally made by visual observation, which varies among operators. Unbiased quantification of cell coverage area helps address these issues.
Current
Issue-1
Variability in passage timing decisions.
Operators usually judge the degree of confluency by visual observation, a qualitative method that is further confounded by variabilities in judgment among multiple operators.
Issue-2
Reliable prediction of the degree of confluency is difficult
The proliferation rate of primary cells especially varies from lot to lot and will further vary with passage number. Therefore, it is difficult to predict when cells will reach the desired degree of confluency for passaging.
Solution
Non-invasive phase contrast imaging and image analysis allows for the quantification of MSC coverage area.Phase contrast imaging and image analysis of human somatic stem cells (such as MSCs ) allows for the automatic identification of regions occupied by cells, and quantification of the area covered.
Using the BioStudio-T*, a cell observation system that can be installed inside an incubator , phase contrast images can be captured over a long period without perturbing the culture environment. A growth curve can be generated from the time lapse acquisition data.
*This product has been discontinued. If you have any questions about cell cultures, assays, or products, please contact us using the contact form.Cell image analysis software Cell Analysis Module
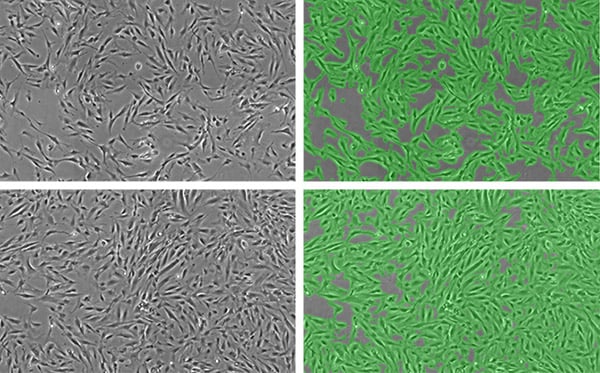
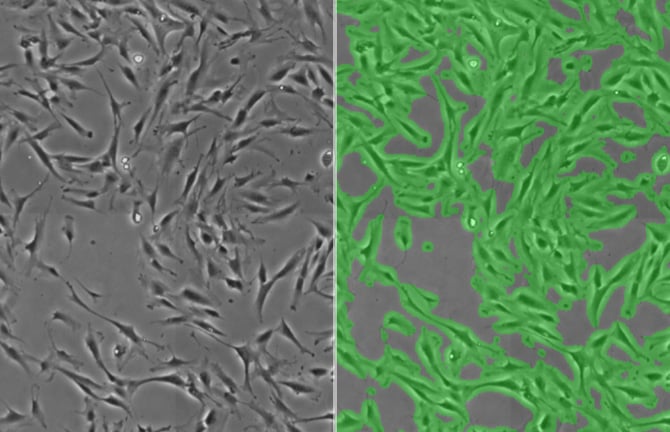
Measurement of the area occupied by MSCs through non-invasive phase contrast imaging and image analysis (bone marrow-derived MSC UE7T-13 lines (JCRB1154))
Cell regions, including cell pseudopodia, can be detected even in an image with varying cell density
Left: phase contrast images, right: detection of area occupied by cells by image analysis
top: low density, bottom: mid density
Utilization scene
As an evaluation criterium for establishing cell culture processes and procedures
- Validation of culture conditions
- Understanding the upper limit of passage number and population doubling number, medium composition, passaging procedure, etc.
- Detection of cells which proliferate abnormally due to transformation
- Comparison of proliferation among cell lines
Cell image analysis software
NIS-Elements Cell Analysis Module
The following application softwares are for the purpose that specific image analysis can be performed simply using Nikon's Image Analysis Software in the field of research and development. As we have developed image analysis algorithms for many years and accumulated know-how, we have started to provide add-on Modules.
Click here for detailsNikon will contribute to solving your cell culture issues with its image analysis
techniques and know-how on cell quality evaluation.
Click hereInquiry Form
Share this page